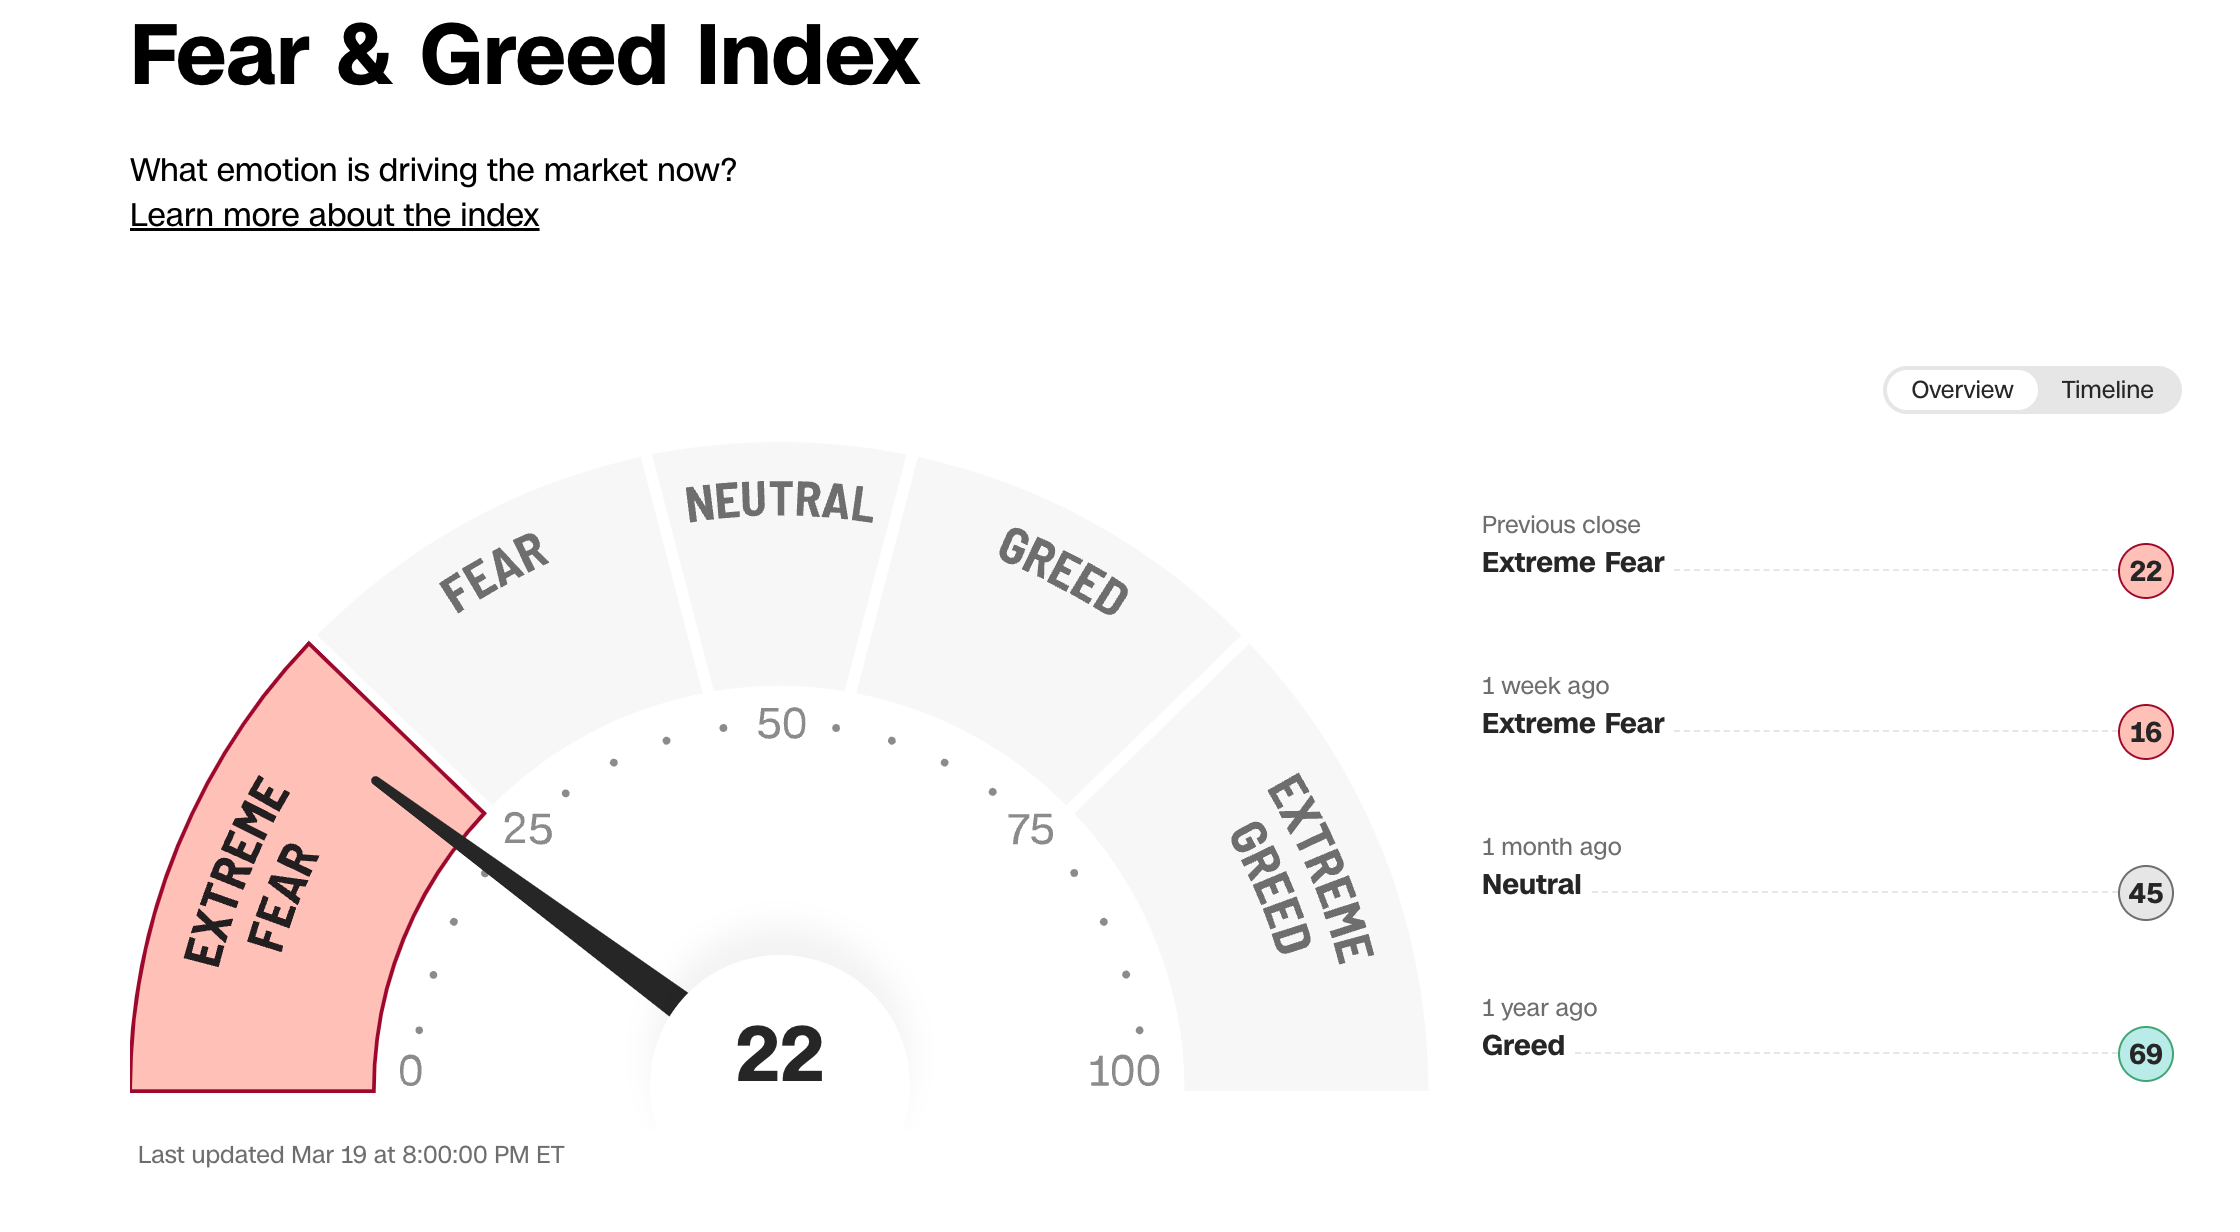
The Emotional Rollercoaster: Understanding the CNN Fear & Greed Index
This is education only, folks. Not trading/investment advice – talk to a financial pro for that. We buy all our tools, no freebies! Some links may earn us affiliate income.
The financial markets are a wild ride, driven as much by human emotion as by cold, hard data. One of the most intriguing tools for gauging these emotional swings is the CNN Fear & Greed Index
. It's designed to give you a snapshot of whether investors are feeling overly fearful or excessively greedy. Let's break down what it measures and how you can use it to your advantage.
What Does the Index Measure?
The Fear & Greed Index isn't based on a single metric. Instead, it's a composite of seven different indicators:
- Stock Price Momentum: This looks at the S&P 500's performance relative to its 125-day moving average. Significant deviations can signal overbought or oversold conditions.
- Stock Price Strength: This indicator measures the number of stocks hitting 52-week highs versus those hitting 52-week lows on the New York Stock Exchange.
- Stock Price Breadth: This compares the volume of advancing stocks to declining stocks.
- Put and Call Options: This looks at the ratio of put options (bets on a decline) to call options (bets on a rise). A high put/call ratio suggests fear, while a low ratio suggests greed.
- Junk Bond Demand: This measures the spread between yields on investment-grade bonds and junk bonds. A narrowing spread indicates greater risk appetite (greed), while a widening spread suggests fear.
- Market Volatility: This looks at the CBOE Volatility Index (VIX), often called the "fear gauge." High VIX levels indicate fear, while low levels suggest complacency.
- Safe-Haven Demand: This compares the performance of stocks versus bonds. Increased bond demand indicates more fear.
These seven indicators are combined to give an overall reading on a scale of 0 to 100:
- 0-25: Extreme Fear
- 25-45: Fear
- 45-55: Neutral
- 55-75: Greed
- 75-100: Extreme Greed
The Contrarian Advantage
The real power of the Fear & Greed Index lies in its potential as a contrarian indicator. The idea is that when everyone is fearful, it might be a good time to buy, and when everyone is greedy, it might be a good time to sell.
Here's why:
- Extreme Fear: When fear is rampant, stock prices are often depressed. This can create opportunities to buy solid companies at discounted prices. Think of it as a fire sale.
- Extreme Greed: When greed takes over, stock prices can become inflated, and valuations can become stretched. This can be a sign that a correction is looming. Everyone is buying, and there are few buyers left.
Using the Index Wisely
It's crucial to remember that the Fear & Greed Index is just one tool in your arsenal. It shouldn't be used in isolation. Here are a few tips:
- Combine it with other indicators: Look at fundamental analysis, technical analysis, and other sentiment indicators to get a more complete picture.
- Don't try to time the market perfectly: The index can help you identify potential turning points, but it won't tell you exactly when to buy or sell.
- Consider the overall economic context: The index can be influenced by short-term sentiment, but long-term trends are often driven by economic fundamentals.
- Use it as a guide, not a rule: The index shows sentiment, but it is not always correct.
Example of the Index in Action
Imagine the index is showing "Extreme Fear." News headlines are filled with doom and gloom, and stock prices are plummeting. Many investors are panicking and selling. This could be a signal to start looking for buying opportunities. Conversely, if the index is showing "Extreme Greed," and everyone is talking about how easy it is to make money in the stock market, it might be time to take some profits.
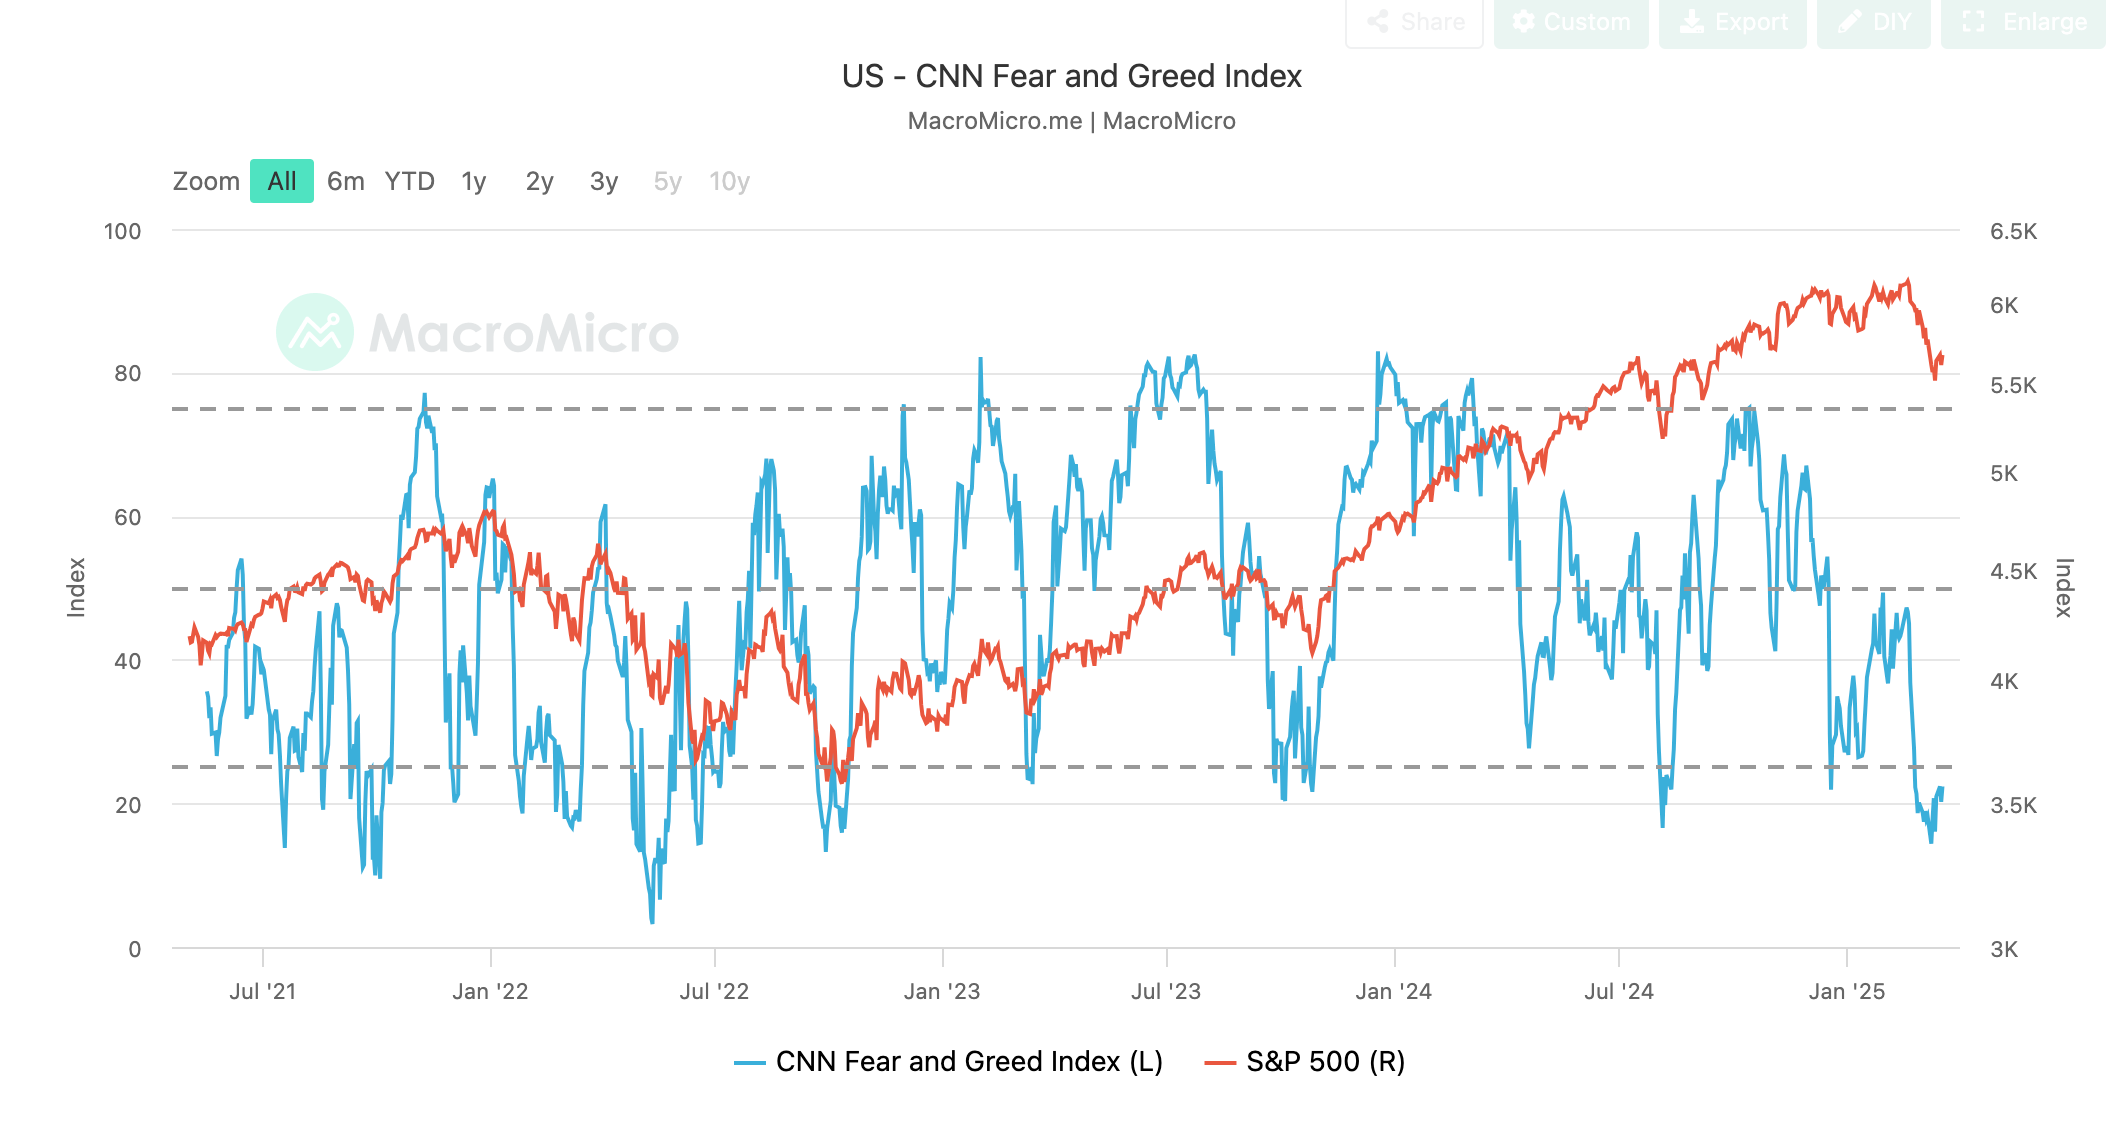
MacroMicro provides a useful tool where you can see how the Fear and Greed index has correlated with the S&P 500: